


 Book Appointment

![]() April 4, 2026
April 4, 2026
![]() 0 Comments
0 Comments

![]() March 20, 2026
March 20, 2026
![]() 0 Comments
0 Comments

![]() March 7, 2026
March 7, 2026
![]() 0 Comments
0 Comments

![]() February 21, 2026
February 21, 2026
![]() 0 Comments
0 Comments

![]() February 6, 2026
February 6, 2026
![]() 0 Comments
0 Comments
![]() January 17, 2026
January 17, 2026
![]() 0 Comments
0 Comments

![]() January 3, 2026
January 3, 2026
![]() 0 Comments
0 Comments

![]() December 27, 2025
December 27, 2025
![]() 0 Comments
0 Comments

![]() December 20, 2025
December 20, 2025
![]() 0 Comments
0 Comments

![]() December 13, 2025
December 13, 2025
![]() 0 Comments
0 Comments
![]() December 6, 2025
December 6, 2025
![]() 0 Comments
0 Comments

![]() November 29, 2025
November 29, 2025
![]() 0 Comments
0 Comments
![]() November 22, 2025
November 22, 2025
![]() 0 Comments
0 Comments

![]() November 14, 2025
November 14, 2025
![]() 0 Comments
0 Comments

![]() November 8, 2025
November 8, 2025
![]() 0 Comments
0 Comments
![]() November 1, 2025
November 1, 2025
![]() 0 Comments
0 Comments

![]() October 24, 2025
October 24, 2025
![]() 0 Comments
0 Comments

![]() October 11, 2025
October 11, 2025
![]() 0 Comments
0 Comments

![]() October 4, 2025
October 4, 2025
![]() 0 Comments
0 Comments

![]() September 27, 2025
September 27, 2025
![]() 0 Comments
0 Comments

![]() September 20, 2025
September 20, 2025
![]() 0 Comments
0 Comments

![]() September 12, 2025
September 12, 2025
![]() 0 Comments
0 Comments

![]() September 6, 2025
September 6, 2025
![]() 0 Comments
0 Comments

![]() August 29, 2025
August 29, 2025
![]() 0 Comments
0 Comments

![]() August 23, 2025
August 23, 2025
![]() 0 Comments
0 Comments

![]() August 16, 2025
August 16, 2025
![]() 0 Comments
0 Comments

![]() August 9, 2025
August 9, 2025
![]() 0 Comments
0 Comments

![]() August 2, 2025
August 2, 2025
![]() 0 Comments
0 Comments

![]() July 25, 2025
July 25, 2025
![]() 0 Comments
0 Comments

![]() July 19, 2025
July 19, 2025
![]() 0 Comments
0 Comments
![]() July 11, 2025
July 11, 2025
![]() 0 Comments
0 Comments

![]() July 4, 2025
July 4, 2025
![]() 0 Comments
0 Comments
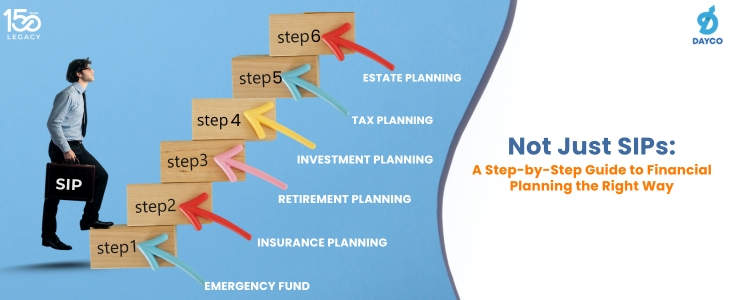
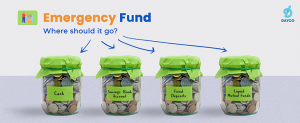
Go from unprepared to ready for anything with these seven easy steps to financial freedom and security.
Continue Reading![]() June 27, 2025
June 27, 2025
![]() 0 Comments
0 Comments
![]() June 21, 2025
June 21, 2025
![]() 0 Comments
0 Comments

![]() June 14, 2025
June 14, 2025
![]() 0 Comments
0 Comments

![]() June 7, 2025
June 7, 2025
![]() 0 Comments
0 Comments
![]() May 31, 2025
May 31, 2025
![]() 0 Comments
0 Comments

![]() May 24, 2025
May 24, 2025
![]() 0 Comments
0 Comments

![]() May 17, 2025
May 17, 2025
![]() 0 Comments
0 Comments

![]() May 10, 2025
May 10, 2025
![]() 0 Comments
0 Comments

![]() May 3, 2025
May 3, 2025
![]() 0 Comments
0 Comments
![]() April 26, 2025
April 26, 2025
![]() 0 Comments
0 Comments

![]() April 19, 2025
April 19, 2025
![]() 0 Comments
0 Comments
![]() April 12, 2025
April 12, 2025
![]() 0 Comments
0 Comments

![]() April 5, 2025
April 5, 2025
![]() 0 Comments
0 Comments
![]() March 28, 2025
March 28, 2025
![]() 0 Comments
0 Comments

![]() March 22, 2025
March 22, 2025
![]() 0 Comments
0 Comments

![]() March 14, 2025
March 14, 2025
![]() 0 Comments
0 Comments

![]() March 7, 2025
March 7, 2025
![]() 0 Comments
0 Comments

![]() February 28, 2025
February 28, 2025
![]() 0 Comments
0 Comments

![]() February 18, 2025
February 18, 2025
![]() 0 Comments
0 Comments

![]() February 8, 2025
February 8, 2025
![]() 0 Comments
0 Comments

![]() February 6, 2025
February 6, 2025
![]() 0 Comments
0 Comments

![]() February 1, 2025
February 1, 2025
![]() 0 Comments
0 Comments

![]() January 20, 2025
January 20, 2025
![]() 0 Comments
0 Comments

![]() December 20, 2024
December 20, 2024
![]() 0 Comments
0 Comments

![]() December 20, 2024
December 20, 2024
![]() 0 Comments
0 Comments

![]() December 12, 2024
December 12, 2024
![]() 0 Comments
0 Comments

![]() December 7, 2024
December 7, 2024
![]() 0 Comments
0 Comments

![]() November 22, 2024
November 22, 2024
![]() 0 Comments
0 Comments

![]() November 21, 2024
November 21, 2024
![]() 0 Comments
0 Comments

![]() November 14, 2024
November 14, 2024
![]() 0 Comments
0 Comments

![]() November 14, 2024
November 14, 2024
![]() 0 Comments
0 Comments

![]() November 8, 2024
November 8, 2024
![]() 0 Comments
0 Comments

![]() November 7, 2024
November 7, 2024
![]() 0 Comments
0 Comments

![]() November 5, 2024
November 5, 2024
![]() 0 Comments
0 Comments

![]() November 2, 2024
November 2, 2024
![]() 0 Comments
0 Comments

![]() October 26, 2024
October 26, 2024
![]() 0 Comments
0 Comments

![]() October 21, 2024
October 21, 2024
![]() 0 Comments
0 Comments

![]() October 11, 2024
October 11, 2024
![]() 0 Comments
0 Comments

![]() October 4, 2024
October 4, 2024
![]() 0 Comments
0 Comments

![]() September 27, 2024
September 27, 2024
![]() 0 Comments
0 Comments

![]() September 2, 2024
September 2, 2024
![]() 0 Comments
0 Comments
![]() September 2, 2024
September 2, 2024
![]() 0 Comments
0 Comments

![]() August 31, 2024
August 31, 2024
![]() 0 Comments
0 Comments

![]() August 17, 2024
August 17, 2024
![]() 0 Comments
0 Comments

![]() August 10, 2024
August 10, 2024
![]() 0 Comments
0 Comments

![]() August 10, 2024
August 10, 2024
![]() 0 Comments
0 Comments
![]() August 7, 2024
August 7, 2024
![]() 0 Comments
0 Comments

![]() August 3, 2024
August 3, 2024
![]() 0 Comments
0 Comments

![]() July 27, 2024
July 27, 2024
![]() 0 Comments
0 Comments

![]() July 22, 2024
July 22, 2024
![]() 0 Comments
0 Comments

![]() July 13, 2024
July 13, 2024
![]() 0 Comments
0 Comments

![]() July 8, 2024
July 8, 2024
![]() 0 Comments
0 Comments

![]() July 6, 2024
July 6, 2024
![]() 0 Comments
0 Comments

![]() July 4, 2024
July 4, 2024
![]() 0 Comments
0 Comments

![]() June 29, 2024
June 29, 2024
![]() 0 Comments
0 Comments

![]() June 22, 2024
June 22, 2024
![]() 0 Comments
0 Comments

![]() June 14, 2024
June 14, 2024
![]() 0 Comments
0 Comments

![]() June 8, 2024
June 8, 2024
![]() 0 Comments
0 Comments

![]() June 1, 2024
June 1, 2024
![]() 0 Comments
0 Comments

![]() May 24, 2024
May 24, 2024
![]() 0 Comments
0 Comments

![]() May 18, 2024
May 18, 2024
![]() 0 Comments
0 Comments

![]() May 18, 2024
May 18, 2024
![]() 0 Comments
0 Comments
![]() May 18, 2024
May 18, 2024
![]() 0 Comments
0 Comments
![]() May 13, 2024
May 13, 2024
![]() 0 Comments
0 Comments

![]() May 11, 2024
May 11, 2024
![]() 0 Comments
0 Comments

![]() May 4, 2024
May 4, 2024
![]() 0 Comments
0 Comments

![]() May 4, 2024
May 4, 2024
![]() 0 Comments
0 Comments

![]() April 29, 2024
April 29, 2024
![]() 0 Comments
0 Comments

![]() April 27, 2024
April 27, 2024
![]() 0 Comments
0 Comments

![]() April 27, 2024
April 27, 2024
![]() 0 Comments
0 Comments

![]() April 20, 2024
April 20, 2024
![]() 0 Comments
0 Comments

![]() April 13, 2024
April 13, 2024
![]() 0 Comments
0 Comments

![]() April 13, 2024
April 13, 2024
![]() 0 Comments
0 Comments

![]() April 11, 2024
April 11, 2024
![]() 0 Comments
0 Comments

![]() April 8, 2024
April 8, 2024
![]() 0 Comments
0 Comments
![]() April 2, 2024
April 2, 2024
![]() 0 Comments
0 Comments

![]() March 22, 2024
March 22, 2024
![]() 0 Comments
0 Comments

![]() March 21, 2024
March 21, 2024
![]() 0 Comments
0 Comments

![]() March 16, 2024
March 16, 2024
![]() 0 Comments
0 Comments

![]() March 10, 2024
March 10, 2024
![]() 0 Comments
0 Comments
![]() March 10, 2024
March 10, 2024
![]() 0 Comments
0 Comments

![]() March 10, 2024
March 10, 2024
![]() 0 Comments
0 Comments

![]() March 10, 2024
March 10, 2024
![]() 0 Comments
0 Comments

![]() March 9, 2024
March 9, 2024
![]() 0 Comments
0 Comments

![]() March 2, 2024
March 2, 2024
![]() 0 Comments
0 Comments

![]() February 24, 2024
February 24, 2024
![]() 0 Comments
0 Comments
![]() February 17, 2024
February 17, 2024
![]() 0 Comments
0 Comments

![]() February 10, 2024
February 10, 2024
![]() 0 Comments
0 Comments

![]() February 3, 2024
February 3, 2024
![]() 0 Comments
0 Comments

![]() January 27, 2024
January 27, 2024
![]() 0 Comments
0 Comments

![]() January 13, 2024
January 13, 2024
![]() 0 Comments
0 Comments

![]() January 6, 2024
January 6, 2024
![]() 0 Comments
0 Comments

![]() December 22, 2023
December 22, 2023
![]() 0 Comments
0 Comments

![]() December 18, 2023
December 18, 2023
![]() 0 Comments
0 Comments

![]() December 16, 2023
December 16, 2023
![]() 0 Comments
0 Comments

![]() December 9, 2023
December 9, 2023
![]() 0 Comments
0 Comments

![]() December 1, 2023
December 1, 2023
![]() 0 Comments
0 Comments

![]() November 25, 2023
November 25, 2023
![]() 0 Comments
0 Comments

![]() November 18, 2023
November 18, 2023
![]() 0 Comments
0 Comments

![]() November 11, 2023
November 11, 2023
![]() 0 Comments
0 Comments

![]() November 4, 2023
November 4, 2023
![]() 0 Comments
0 Comments

![]() October 28, 2023
October 28, 2023
![]() 0 Comments
0 Comments

![]() October 28, 2023
October 28, 2023
![]() 0 Comments
0 Comments

![]() October 14, 2023
October 14, 2023
![]() 0 Comments
0 Comments
![]() October 7, 2023
October 7, 2023
![]() 0 Comments
0 Comments

![]() September 30, 2023
September 30, 2023
![]() 0 Comments
0 Comments

![]() September 23, 2023
September 23, 2023
![]() 0 Comments
0 Comments

![]() September 16, 2023
September 16, 2023
![]() 0 Comments
0 Comments

![]() September 9, 2023
September 9, 2023
![]() 0 Comments
0 Comments

![]() August 31, 2023
August 31, 2023
![]() 0 Comments
0 Comments

![]() August 26, 2023
August 26, 2023
![]() 0 Comments
0 Comments

![]() August 19, 2023
August 19, 2023
![]() 0 Comments
0 Comments

![]() August 12, 2023
August 12, 2023
![]() 0 Comments
0 Comments

![]() August 5, 2023
August 5, 2023
![]() 0 Comments
0 Comments

![]() July 29, 2023
July 29, 2023
![]() 0 Comments
0 Comments

![]() July 28, 2023
July 28, 2023
![]() 0 Comments
0 Comments
![]() July 28, 2023
July 28, 2023
![]() 0 Comments
0 Comments

![]() July 28, 2023
July 28, 2023
![]() 0 Comments
0 Comments

![]() July 28, 2023
July 28, 2023
![]() 0 Comments
0 Comments

![]() July 22, 2023
July 22, 2023
![]() 0 Comments
0 Comments

![]() July 19, 2023
July 19, 2023
![]() 0 Comments
0 Comments

![]() July 15, 2023
July 15, 2023
![]() 0 Comments
0 Comments

![]() July 15, 2023
July 15, 2023
![]() 0 Comments
0 Comments

![]() July 15, 2023
July 15, 2023
![]() 0 Comments
0 Comments

![]() July 10, 2023
July 10, 2023
![]() 0 Comments
0 Comments

![]() July 10, 2023
July 10, 2023
![]() 0 Comments
0 Comments

![]() July 10, 2023
July 10, 2023
![]() 0 Comments
0 Comments
![]() July 10, 2023
July 10, 2023
![]() 0 Comments
0 Comments

![]() July 10, 2023
July 10, 2023
![]() 0 Comments
0 Comments

![]() July 10, 2023
July 10, 2023
![]() 0 Comments
0 Comments
![]() July 10, 2023
July 10, 2023
![]() 0 Comments
0 Comments

![]() July 6, 2023
July 6, 2023
![]() 0 Comments
0 Comments

![]() July 5, 2023
July 5, 2023
![]() 0 Comments
0 Comments

![]() July 5, 2023
July 5, 2023
![]() 0 Comments
0 Comments

![]() July 5, 2023
July 5, 2023
![]() 0 Comments
0 Comments

![]() July 5, 2023
July 5, 2023
![]() 0 Comments
0 Comments

![]() July 5, 2023
July 5, 2023
![]() 0 Comments
0 Comments

![]() July 5, 2023
July 5, 2023
![]() 0 Comments
0 Comments

![]() July 4, 2023
July 4, 2023
![]() 0 Comments
0 Comments

![]() July 4, 2023
July 4, 2023
![]() 0 Comments
0 Comments

![]() July 4, 2023
July 4, 2023
![]() 0 Comments
0 Comments

![]() July 4, 2023
July 4, 2023
![]() 0 Comments
0 Comments

![]() July 4, 2023
July 4, 2023
![]() 0 Comments
0 Comments

![]() June 25, 2023
June 25, 2023
![]() 0 Comments
0 Comments

![]() June 24, 2023
June 24, 2023
![]() 0 Comments
0 Comments
![]() June 23, 2023
June 23, 2023
![]() 0 Comments
0 Comments

![]() June 22, 2023
June 22, 2023
![]() 0 Comments
0 Comments

![]() June 22, 2023
June 22, 2023
![]() 0 Comments
0 Comments

![]() June 22, 2023
June 22, 2023
![]() 0 Comments
0 Comments

![]() June 19, 2023
June 19, 2023
![]() 0 Comments
0 Comments

![]() June 19, 2023
June 19, 2023
![]() 0 Comments
0 Comments

![]() June 19, 2023
June 19, 2023
![]() 0 Comments
0 Comments

![]() June 19, 2023
June 19, 2023
![]() 0 Comments
0 Comments

![]() June 17, 2023
June 17, 2023
![]() 0 Comments
0 Comments

![]() June 16, 2023
June 16, 2023
![]() 0 Comments
0 Comments

![]() June 16, 2023
June 16, 2023
![]() 0 Comments
0 Comments

![]() June 16, 2023
June 16, 2023
![]() 0 Comments
0 Comments
![]() June 16, 2023
June 16, 2023
![]() 0 Comments
0 Comments

![]() June 16, 2023
June 16, 2023
![]() 0 Comments
0 Comments

![]() June 16, 2023
June 16, 2023
![]() 0 Comments
0 Comments

![]() June 15, 2023
June 15, 2023
![]() 0 Comments
0 Comments

![]() June 15, 2023
June 15, 2023
![]() 0 Comments
0 Comments

![]() June 15, 2023
June 15, 2023
![]() 0 Comments
0 Comments

![]() June 14, 2023
June 14, 2023
![]() 0 Comments
0 Comments

![]() June 14, 2023
June 14, 2023
![]() 0 Comments
0 Comments
![]() June 13, 2023
June 13, 2023
![]() 0 Comments
0 Comments

![]() June 13, 2023
June 13, 2023
![]() 0 Comments
0 Comments

![]() June 12, 2023
June 12, 2023
![]() 0 Comments
0 Comments

![]() June 10, 2023
June 10, 2023
![]() 0 Comments
0 Comments

![]() June 5, 2023
June 5, 2023
![]() 0 Comments
0 Comments

![]() June 5, 2023
June 5, 2023
![]() 0 Comments
0 Comments

![]() June 3, 2023
June 3, 2023
![]() 0 Comments
0 Comments

![]() June 2, 2023
June 2, 2023
![]() 0 Comments
0 Comments

![]() June 2, 2023
June 2, 2023
![]() 0 Comments
0 Comments

![]() June 2, 2023
June 2, 2023
![]() 0 Comments
0 Comments

![]() June 2, 2023
June 2, 2023
![]() 0 Comments
0 Comments

![]() June 1, 2023
June 1, 2023
![]() 0 Comments
0 Comments

![]() June 1, 2023
June 1, 2023
![]() 0 Comments
0 Comments

![]() June 1, 2023
June 1, 2023
![]() 0 Comments
0 Comments

![]() June 1, 2023
June 1, 2023
![]() 0 Comments
0 Comments

![]() June 1, 2023
June 1, 2023
![]() 0 Comments
0 Comments

![]() June 1, 2023
June 1, 2023
![]() 0 Comments
0 Comments

![]() June 1, 2023
June 1, 2023
![]() 0 Comments
0 Comments

![]() June 1, 2023
June 1, 2023
![]() 0 Comments
0 Comments

![]() June 1, 2023
June 1, 2023
![]() 0 Comments
0 Comments

![]() May 31, 2023
May 31, 2023
![]() 0 Comments
0 Comments

![]() May 31, 2023
May 31, 2023
![]() 0 Comments
0 Comments

![]() May 30, 2023
May 30, 2023
![]() 0 Comments
0 Comments

![]() May 30, 2023
May 30, 2023
![]() 0 Comments
0 Comments

![]() May 30, 2023
May 30, 2023
![]() 0 Comments
0 Comments

![]() May 30, 2023
May 30, 2023
![]() 0 Comments
0 Comments

![]() May 30, 2023
May 30, 2023
![]() 0 Comments
0 Comments

![]() May 30, 2023
May 30, 2023
![]() 0 Comments
0 Comments

![]() May 24, 2023
May 24, 2023
![]() 0 Comments
0 Comments

![]() May 24, 2023
May 24, 2023
![]() 0 Comments
0 Comments

![]() May 24, 2023
May 24, 2023
![]() 0 Comments
0 Comments

![]() May 24, 2023
May 24, 2023
![]() 0 Comments
0 Comments

![]() May 19, 2023
May 19, 2023
![]() 0 Comments
0 Comments

![]() April 11, 2023
April 11, 2023
![]() 0 Comments
0 Comments

![]() March 27, 2023
March 27, 2023
![]() 0 Comments
0 Comments

![]() March 18, 2023
March 18, 2023
![]() 0 Comments
0 Comments

![]() March 13, 2023
March 13, 2023
![]() 0 Comments
0 Comments
![]() March 13, 2023
March 13, 2023
![]() 0 Comments
0 Comments

![]() March 10, 2023
March 10, 2023
![]() 0 Comments
0 Comments

![]() March 10, 2023
March 10, 2023
![]() 0 Comments
0 Comments

![]() March 10, 2023
March 10, 2023
![]() 0 Comments
0 Comments

![]() February 27, 2023
February 27, 2023
![]() 0 Comments
0 Comments
![]() February 27, 2023
February 27, 2023
![]() 0 Comments
0 Comments

![]() February 27, 2023
February 27, 2023
![]() 0 Comments
0 Comments

![]() February 23, 2023
February 23, 2023
![]() 0 Comments
0 Comments

![]() February 22, 2023
February 22, 2023
![]() 0 Comments
0 Comments

![]() February 22, 2023
February 22, 2023
![]() 0 Comments
0 Comments

![]() February 17, 2023
February 17, 2023
![]() 0 Comments
0 Comments

![]() February 17, 2023
February 17, 2023
![]() 0 Comments
0 Comments

![]() February 17, 2023
February 17, 2023
![]() 0 Comments
0 Comments

![]() February 16, 2023
February 16, 2023
![]() 0 Comments
0 Comments

![]() February 16, 2023
February 16, 2023
![]() 0 Comments
0 Comments

![]() February 16, 2023
February 16, 2023
![]() 0 Comments
0 Comments

![]() February 16, 2023
February 16, 2023
![]() 0 Comments
0 Comments

![]() January 13, 2023
January 13, 2023
![]() 0 Comments
0 Comments

![]() January 4, 2023
January 4, 2023
![]() 0 Comments
0 Comments

![]() December 19, 2022
December 19, 2022
![]() 0 Comments
0 Comments

![]() October 1, 2022
October 1, 2022
![]() 0 Comments
0 Comments

![]() August 13, 2022
August 13, 2022
![]() 0 Comments
0 Comments

![]() August 21, 2021
August 21, 2021
![]() 0 Comments
0 Comments

I'm a cool paragraph that lives inside of an even cooler modal. Wins!
In case you didn’t know, you can open your account online within 24 hours. Offline account opening takes up to 4 working days. If you wish to open your account offline, fill and sign the forms using a black/blue ballpoint pen. Please fill in the email and mobile number of the applicant to avoid account opening delays.
Please enter your details and password
New to Dayco?
Please enter your details and password
New to Dayco?
Your details were successfully received.

Our Team is working constantly on improving our user experience and your feedback really means a lot.
App Link Send to your mobile number successfully.
All your Questions have been recorded
All your Questions have been recorded
Thank you for your response. We'll get in touch with you at the earlisest for your investment planning needs
Thank You for your interest in our Moderate Equity Portfolio. Please find below the credentials to track this portfolio:
User ID: mockmod@daycoindia.com
Password: abcd@1234
Risk profiling is crucial for identifying and managing potential risks in investment decisions. Please carry out your risk profiling before making any investment decisions.
Please enter your details to download/print the report
Please enter your details to download/print the report
Please enter your details to download/print the report
Please enter your details to download/print the report
Please enter your details to download/print the report

Please Select an option from below
Please Select an option from below
We appreciate your interest in our services. Our team will be in touch with you shortly.
ClosePlease enter your details in the fields provided
Calculation report has been sent to your mail id successfully
This will remove your answers from all questions and cannot be undone.


