

Investing your hard-earned money in stocks requires a lot of research and a lot less guesswork. You cannot be shooting in the dark and expect to get profits. Every investor, seasoned or amateur, must be acquainted with the ups and downs of the stock market and securities. Thanks to different analytical tools, that is largely possible today. Technical analysis is a comprehensive method of analysing stocks. How? Welcome to the first part of the blog series on technical analysis. Let’s dig deep.
What is Technical Analysis?
Technical analysis is a stock analysis paradigm that involves finding patterns in stock charts and using those patterns to make an educated guess on how the market will behave.
The ups and downs in the stock market are closely related to how human psychology works. It is the human sentiment that drives the market. Technical analysis enables us to gain an insight into this sentiment. Human psychology has a pattern, and this pattern – on a mass level – is reflected in the stock market as well. On a very basic level, technical analysis tries to find a pattern between the prevailing market sentiment and the trend being formed in the charts.
On a very basic level, technical analysis quantifies the theories regarding the ups and downs in the market. For example, if the share price of a stock that was on a downward trend suddenly reverses the movement and orchestrates a breakout – every aspect of that stock – at that moment – can be mathematically quantified. What are these aspects? From volume to the pattern in the candlestick chart, from simple moving averages of the recent closing prices to support or resistance levels – everything that can be mathematically quantifiable.
Why Is Technical Analysis Important?
The ups and downs in the stock market are closely related to how human psychology works. It is the human sentiment that drives the market. Technical analysis enables us to gain an insight into this sentiment. Human psychology has a pattern and this pattern – on a mass level – is reflected in the stock market as well. On a very basic level, technical analysis tries to find a pattern between the prevailing market sentiment and the trend being formed in the charts.
How Does Technical Analysis Differ From Fundamental Analysis?
There are two schools of thought when it comes to approaching market-fundamental analysis and technical analysis. However, they are the polar opposite. The fundamental analysis measures the intrinsic values of the securities. It focuses on the overall economy, industry trends, market conditions and financial health of the company.
However, technical analysis has a concentrated approach and evaluates prices and volume of the stock. It does not examine the intrinsic value of the stock but assumes all factors are included in the stock’s price. Technical analysis uses charts and different indicators to examine trends and estimate how a stock will perform in the future.
The Two Main Kinds of Charts:
There are many charts that traders and investors use to gain insights into market sentiment and market momentum. However, the most widely used charts are:
- Line chart
- Candlestick chart
Line charts are quite simple. It represents the closing price of a stock per time unit. The time unit can be minute, hour, day, week, month or year. Yes, these charts obviously can’t be able to throw much light into the stock price and the pattern in its movement. However, sometimes, minimalism is needed to cut all the distractions in the form of unnecessary data. Line charts enable you to see the price trend in a clean, no-noise format. Sometimes that’s all you need.
Candlestick Chart: The Hero In Technical Analysis
It is the traditional Japanese candlestick chart that empowers traders to perform technical analysis in a comprehensive manner. The best part about candlesticks is that it is an OHLC chart, which means that it shows the open price, the closing price and the highest and lowest price points as well.
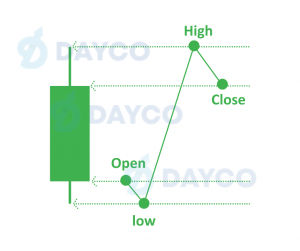
A candlestick showing OHLC. (The price moved higher than the previous time unit, hence, green)
The patterns made by the candlestick chart are used widely by technical analysts to make educated guesses about the price movement.
Assumptions and Caveats of Technical Analysis:
Moving on from the principles, here are the assumptions and caveats of technical analysis.
- Assumptions of Technical Analysis:
Three primary assumptions of technical analysis are similar to its principles.
- History repeats itself
Technical analysis relies on historical data. If a price behaviour portrayed a certain pattern in the past, the first principle states that it will mimic the old patterns in the future.
Technical analysis assumes that security will display its past trends in the future, especially when it comes to price movement.
- Price will move in a specific direction
Technical analysts assume that prices do not move randomly but follow a pre-determined direction. Such a movement is known as a price trend. Once a trend is established, the price will move in that direction rather than defying it.
- Prices consider all market factors
It is assumed that at any given time the price of a stock will reflect all factors that are impacting it. Technical analysts do not view organizational or market determinants separately from the security’s price. Rather believe that the price of the security reflects all elements that affect the company and market. Therefore, technical analysts do not have to consider any macro or micro components.
- Caveats Of Technical Analysis:
Technical analysis is awesome, but be careful. It does have some cons as well:
- Always remember that history might not repeat every single time. The stock market is dynamic. New factors, new kinds of sentiment and new economic conditions can make technical analysis quite useless sometimes.
- Another problem with technical analysis is subjectivity. Although all the technical indicators are quite well-defined, individual traders approach them with their own biases and ways of analysing things. This can be problematic and can lead to making wrong decisions.
- As a retail trader, you must remember that you are competing against big fishes in the market who use powerful computers and leverage algorithms to identify trends as soon as they emerge. You, as an individual trader, can be quite late in identifying a pattern.
Technical Analysis In Action
There are many technical analysis patterns and indicators. We will talk about the major ones in the next part of this series. But for this article, let’s show you two basic but useful technical analysis patterns and indicators that can make you an informed investor.
- The Double Bottom Pattern:
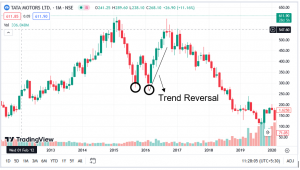
When the share price of a stock touches a low point to form a support level, goes up a little, and then again touches the support level, you will see a ‘W’ pattern. In technical analysis terms, we call it the double bottom pattern. It is a bullish reversal indicator which means that after the W pattern is formed, the price is likely to move in an upward trend.
Back in September 2015 and February 2016, the stock price of Tata Motors formed a W pattern, and it did move upward after the pattern was formed.
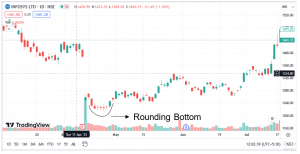
- The Rounding Bottom Pattern
When the lower part of both the green and red candles form a round shape, it indicates a bullish uptrend. In April 2023, the chart of Infosys displayed such a pattern –
[Disclaimer: both the screenshots above have been taken from Tradingview. All rights to the Tradingview Logo and trademark rest with the said company. The images are for editorial purposes only. We do not promote the platform]
Conclusion
Technical analysis is extremely helpful if used correctly and in conjunction with fundamental analysis. Don’t be overconfident about your skill of identifying technical trends, and you will be good to go
It’s better if you don’t see technical and fundamental analysis as two opposing paradigms. Rather, see them complementing each other. No matter whether you are a trader or investor, the Dayco app is ready to serve you in every way possible.
If you have a question, share it in the comments below or DM us or call us – +91 9051052222. We’ll be happy to answer it.


