

If you are here, you must be aware of technical analysis. Anyway, to brush up on the concepts, you can visit the first part of this blog series on technical analysis here. This is the second part, where we will be walking you through the concepts that facilitate technical analysis.
What are technical indicators?
The opening and closing prices of a stock are not just any random events. They represent the behaviour of the market participant and the price trend. Traders perform mathematical calculations using this price data to come up with insights about stocks.
|
Remember |
|
Although you will always see technical indicators being used in a candlestick chart, you should remember that technical indicators do NOT depend on any particular chart. Yes, candlestick charts make technical indicators more useful, but these indicators can function independently of the chart. |
What is the moving average, and what is its importance?
The underlying concept of moving average is similar to that of the basic average taught in schools. However, it gets slightly complex as it is used in technical trend analysis. Nevertheless, the moving average is widely used because of its effectiveness and ease of understanding.
Here, the closing prices of a stock, over a certain period, are added. The sum is then divided by the number of closing prices taken into consideration. This gives the average of the closing prices corresponding to the specific period. Since the average is continuously updated as time or day passes, we call it a ‘moving’ average.
Moving averages are used by market participants to estimate the support and resistance of a security by examining the movements in its price. The moving average is also known as a lagging indicator. This technical indicator reveals the earlier price movement of an asset. Such data helps traders and investors decipher the probable directions of the security price.
What are the different types of moving averages?
There are four types of moving averages-simple moving averages, and exponential moving averages.
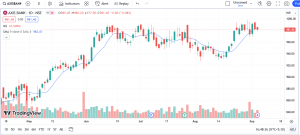
1. Simple moving average: A simple moving average just takes the closing prices of a stock over a fixed number (usually 20) of minutes, hours, weeks, days, or months (or even years) and then calculates the average of those prices. The average is recalculated every passing minute, hour, week or month. So, the Simple Moving Average forms a trend line over the specified period.
This is what an SMA looks like –
Disclaimer: The trademark TradingView belongs to the company
2. As you can see, the ups and downs in the SMA are in line with the ups and downs in the price of the stock.SMA helps you to identify a downward or upward trend in the stock price movement. However, the Simple Moving Average is not very effective in identifying such a trend before it becomes apparent. This is where Exponential Moving Average comes in.
3. Exponential moving average: The Simple Moving Average gives the same weightage to all the price points. What if we give more weightage to the recent price points? The curvature of such a moving average will be more pronounced. This is what an Exponential Moving Average does.Look at this –
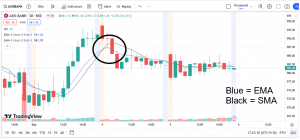
As you can see in the circled part, EMA is more sensitive than SMA. When the SMA was still moving up, EMA displayed a reversal.
To calculate EMA, you need to use this formula:
EMA = (Closing price – Previous EMA) * Multiplier + Previous EMA
Here, the multiplier is the one that determines how much weightage should be given to the recent price points. Usually, it is taken as 2/11. In case the previous EMA is not available, use SMA.
4. Weighted moving average: In the case of the weighted moving average, weights are assigned to each data point depending on its age. The most recent ones get more importance. Unlike a simple moving average, the weighted moving average is more sensitive to price changes.
5. Hull moving average: Preferred by many traders, the hull moving average is a directional trend indicator. It is a combination of all weighted moving averages. Similar to WMAs, it also focuses on recent price points rather than historical ones. Its developer, Alan Hull, claimed that HMA eliminates lag and gives a dynamic moving average that helps identify dominating market trends.
Different applications of moving average:
- The primary purpose of a moving average is to identify price trends before they become apparent.
- Once the price trend is identified, the moving averages help traders make informed buying or selling decisions.
- Specialised moving averages can be used to identify the direction of a trend.
What is a moving average crossover?
In the moving average crossover system, a trader combines two moving averages, and this system is known as smoothening. A common example is combining a 50-day EMA with a 100-day EMA, where the shorter moving average is referred to as the faster-moving average, and the longer one is called the slower moving average. It helps traders to lower the number of trades in a sideways market.
| Moving averages are the building blocks of many other technical indicators. This is why we focused on them in such a detailed way. |
Other Common Technical Indicators and Their Applications:
1. Relative Strength Index (RSI): RSI is technically known as the ‘momentum indicator,’ However, it is used to identify whether a stock is in an overbought zone or oversold zone. To calculate RSI, you first need to find out the average of up closes and the average of down closes. Then, you need to divide the first result with the second one. An RSI of 70 indicates that the stock is in an overbought zone, while an RSI of 30 indicates that the stock is in an oversold zone.
2. Elder Force Index: You can also identify oversold or overbought conditions by examining the volume of trades. The Elder Force Index does this. The EFI is calculated by dividing the volume of up closes by the volume of down closes and then multiplying the result by 100. An EFI of 70 indicates a strong buying pressure, while an EFI of less than 30 indicates a strong selling pressure.
3. Bollinger Bands: One of the overlay technical indicators is the Bollinger Bands, developed by technical trader John Bollinger. It is a technical analysis tool represented by a set of trendlines. This tool helps traders when an asset is oversold or overbought. Three lines are plotted, where the upper and the lower bands are two standard deviations, positive and negative, respectively. The middle band is the simple moving average. Based on the security price’s vicinity towards the upper or lower line, traders determine if the market is overbought or oversold.
4. Volume-weighted Average Price (VWAP): It is a measure of a security’s average price over a trading period. VWAP is used on intraday charts that reset every day when the market opens. Mostly useful in short-term trading, this single-line indicator gives insights into the trend and value of a security’s price.
Conclusion:
There are several tools that facilitate technical analysis. However, developing a thorough understanding of each of these indicators is important before diving deep into the market. From portfolio risk management to identifying trend changes, you can find all the help you need in the Dayco app.
Hope you found the article useful!
If you have a question, share it in the comments below or DM us or call us – +91 9051052222. We’ll be happy to answer it.


